
What Is Google Analytics and How Does It Work?
Everyone wants their website to be successful but posting regular content that you believe is engaging might not be enough.
Contents:
- Who Should Use Google Analytics?
- How Much Does It Cost to Use Google Analytics?
- How Does Google Analytics Work?
- What Kind Of Data Does Google Analytics Offer?
- How Do I Install Google Analytics?
- How Do I Use Google Analytics?
What is more important is how your users see your website. Do they purchase your items or are they just browsing? Do they stick around and read your content? Do they return to your website and how often?
To find out the answers to these and many other questions on the road to building a successful online business, you need the help of Google Analytics.
Who Should Use Google Analytics?
Google Analytics is the number one tool for every website owner who wants to increase the traffic to their website and understand how it behaves.
At the moment there are over 50 million websites that use Google Analytics. From personal blogs to complex business websites, Google Analytics allows its users to find out how their website is perceived by the audience.
The tool is especially useful when you are running marketing campaigns. When you decide to invest in ads, the best approach usually involves advertising on multiple platforms and running different kinds of ads.
By using Google Analytics, you gain valuable insights on where your visitors are coming from. By analysing the source of the traffic during the campaign you can separate the ads that bring you the most traffic and boost them to optimise your results.
In other words, the tool tells you which campaigns are successful, and which are not.
Google Analytics can also help you if you need to narrow down your target audience as it provides demographic information on the users visiting your website. Use their age, gender, interests, or location in your next marketing campaign for better targeting and maximise the return on your investment.

How Much Does It Cost to Use Google Analytics?
Google Analytics is often referred to as a free tool but this is only partly true.
Google Analytics is a web analytics service offered by Google that tracks and reports website traffic – Wikipedia
If you’re running a small or medium-sized business or a personal website then you can take advantage of the functionalities offered by the platform for free. The current guide covers the free version that is available to all website owners that need a tool for tracking their traffic.
Still, to be fair we should mention that there is another version of Google Analytics that is meant for large enterprises. The Google Analytics 360, formally known as Google Analytics Premium, comes at the extravagant price of $150,000 a year.
For this amount you’ll get:
- monthly hits capability increased from 10 million to 500 million hits
- improved customisation on data and reports
- advanced analytical solutions
Luckily, while the advanced analytics of the Google Analytics 360 are impressive, the basic version won’t cost you anything and is still unmatched by competitors in terms of tracking capabilities.

How Does Google Analytics Work?
To put it simply, when you connect your website to the tool, it adds several lines of code to your site. These several lines do all the magic by recording your users’ activities and attributes, i.e. age, gender, location, interests, browser information, etc. The data is then sent over to Google headquarters, where a dedicated algorithm crunches it.
Once the user quits the session by leaving your website, the collected data is sent to the Google Analytics server. The compound information is then summarised on four general levels:
- User level. How each user engaged with your website.
- Session level. Provides information on each individual visit.
- Pageview level. Collects information on each page that was visited.
- Event level. Analyses video views, button clicks, and other events that happened during the session.
What Kind Of Data Does Google Analytics Offer?
While there are tons of reports to look at in Google Analytics, there are two main types of data that you can get from the tool:
- who visited your website
- how they engaged with it
Learning how to use this data to your advantage is the key to transforming “just another website” into a successful business tool.
Can Google Analytics Tell You Who Is Visiting Your Site?
Google Analytics can tell you much about the users visiting your website. This type of data is known as User Acquisition Data.
In essence, it gives you information on the user before they visited your website. The details that you can get for each user include:
- age
- gender
- interest
- location
- language
- source to your website (social media, another website, or a Google search)
While you cannot change the data, i.e. force visitors with other demographics or interests to your website, you could take advantage and use the information to increase your traffic.
The user acquisition data serves as a guide to your strong and weak channels and could help for better targeting during your next advertising campaign.
Can Google Analytics Tell You How People Engage With Your Site?
The other type of data collected by Google Analytics tells you more about how people spend their time on your website. It’s called user behaviour data and unlike the acquisition data, this one is taken while the user is browsing the site.
The information extracted from the user behaviour data includes:
- Which is the first and last page the user viewed?
- How did they move through your website page by page?
- How long did they stay on each page and on the website?
While user acquisition data helps you improve your targeting, user behaviour data gives you insights on how to improve your website so the users can be converted from visitors to customers or subscribers.
There are several important signs you should look for in your user behaviour reports:
- There are pages that the users visit but do not spend much time on. If a user spends only a few seconds on a page that means that it’s either not what they expected or just not engaging enough. Spend some time reviewing and improving these pages to keep their interest.
- There are important pages that visitors just don’t visit often enough. Maybe the page is hard to find. It is a good rule of thumb to have a link to all important pages available in the menu.
- People often leave your website after visiting a specific page. Users may get stuck if the website is not intuitive to navigate through. Most people don’t like to click the back browser button. Instead, they expect a smooth user experience or turn to another source.
By analysing the user behaviour data you have the opportunity to greatly improve the user experience on your website and thus retain and convert your visitors.

How Do I Install Google Analytics?
Once we’ve covered the basics of why any website owner needs to track and analyse their traffic, we are ready to jump to the setup.
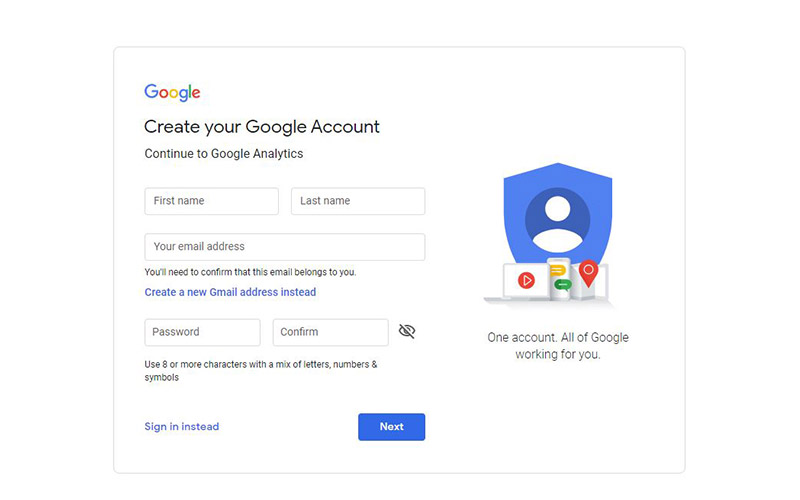
Creating An Account
First off, you will need to create a Google Analytics account. If you have a Google account that you use for your emails, Drive or YouTube, you can use it to register for the platform. If not, you will need to create one in order to proceed.
Keep in mind that this account should be permanently linked to your website. Therefore, it is important that only you have access to it. If you use someone’s account or give them access to your account so they can manage the account for you, you risk losing all your data if one day you decide to stop working with them.
Setting Up The Account
Once you have your account you can click the Sign up for free button and start the setup process. A user-friendly interface will guide you through the entire process.
On the first page, you will need to enter your Account name and select the Account Data Sharing Settings. Sharing your data with Google is essential for the development of the platform, therefore, all options are selected by default as recommended. Of course, you could opt out of any of them and still use Google Analytics.
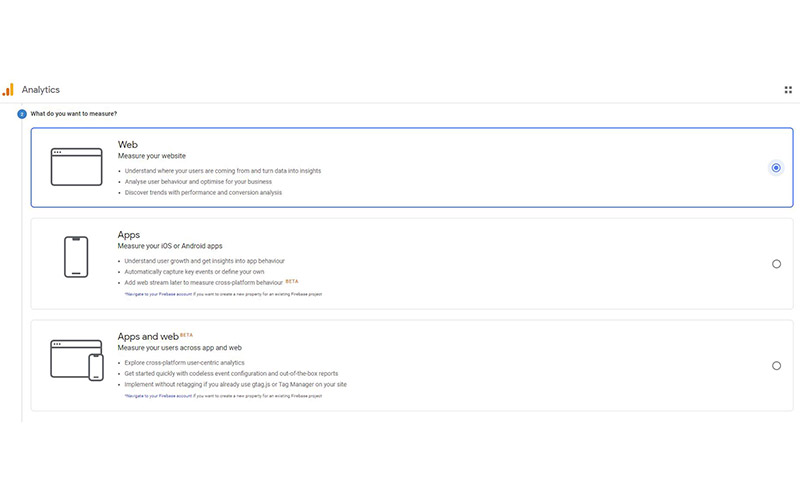
On the next step, you will need to select what you are going to measure. There are three options available:
- Web. If you are going to track a website only.
- Apps. If you need to track Android or iOS apps only.
- Apps and web. If you need to track your users on both platforms. This option is still in a beta stage.
Once this is also cleared out, the wizard will prompt for your website data, including:
- Website Name
- Website URL
- Industry Category
- Reporting Time Zone
After you enter all the details, click the “Create” button. You will need to accept the terms on the Google Analytics Service Agreement and the Additional Terms Applicable to Data Shared with Google.
Connect Your Tracking Code
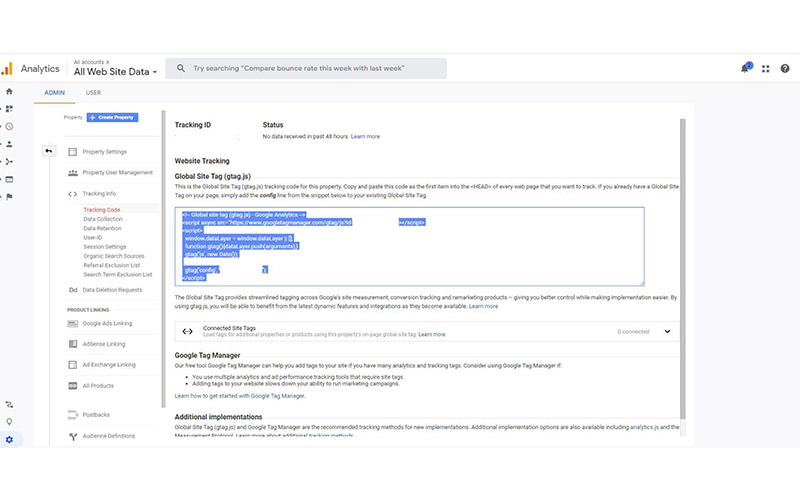
Once you’ve agreed to their terms you will receive your Tracking Code or Tracking ID. The code needs to be installed on every page you want to track with Google Analytics.
To do this you would need to copy the Global Site Tag (gtag.js) and paste it into the <HEAD> section of each page.
The exact way to add the script depends on the type of website you’re linking.
If you have a WordPress website, then you have several ways to continue.
- If your website has a built-in Google Analytics plugin, all you need to do is enter the Tracking ID and that’s it.
- If you don’t have a Google Analytics plugin, you could use a plugin like “Insert Headers and Footers” or alternative solutions. The plugin will provide you with the option to easily add the script to the header (<HEAD>) without dealing with the actual code of the page.
- If you have hired a Melbourne website designer or developer to build your website because you find working with scripts challenging, you could send them the tracking ID so they can install it. Remember to only send the Tracking ID and/or script and not the details of your linked Google Account.
Setting Goals
Once you’ve linked your Tracking ID, your Google Analytics is ready to go. There is, however, a useful feature that you may wish to configure first.
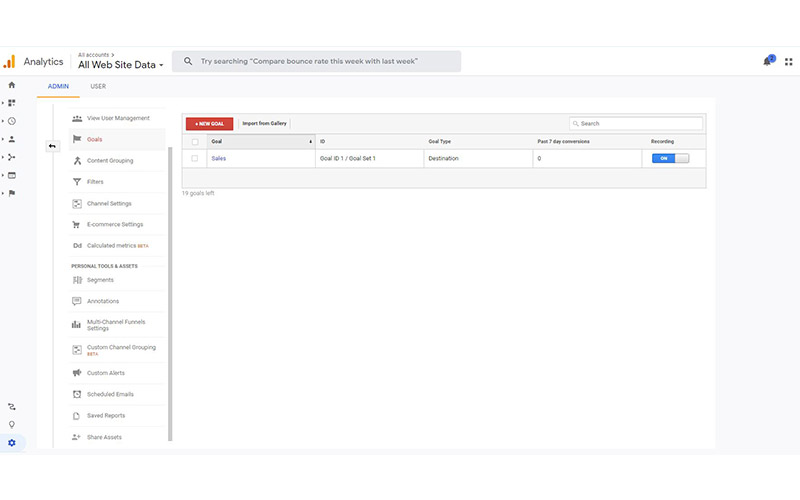
Goals is a functionality that helps you track conversions on your website. Have you subscribed to a mailing list or purchased an item online, after which you have been redirected to a “Thank you” page? This is something you can do with goals.
To set up a goal go to the Admin settings. In the View column you will find the Goals option. Clicking on the “New Goal” button will open the goal setup panel.
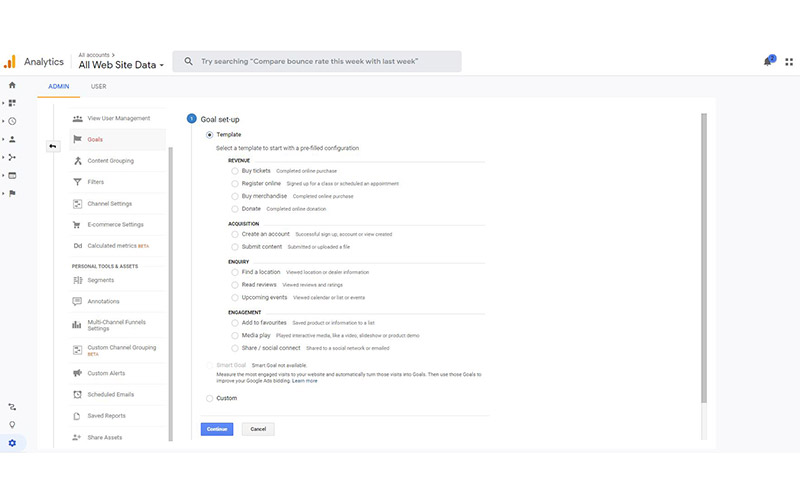
As a first step, you would need to select a template that relates to the goal you’ll be creating. After that, you would need to name your goal, pick a slot (you can create up to 20 goals), and choose the goal type. There are several types of goals to choose from:
- A specified page will be loaded when the template condition is met, e.g. the user made an order and a “Thank you” page is displayed.
- Tracks if the session lasts a specific amount of time or longer.
- Pages/Screens per session. Tracks if the user has viewed at least the specified number of pages on your website.
- Tracks if the user triggers a specified event.
The third step depends on the type of goal you’ve selected and will let you configure it. In the above example, to specify the page that needs to be loaded you need to enter the URL of the page, e.g. “/thankyou.html”.
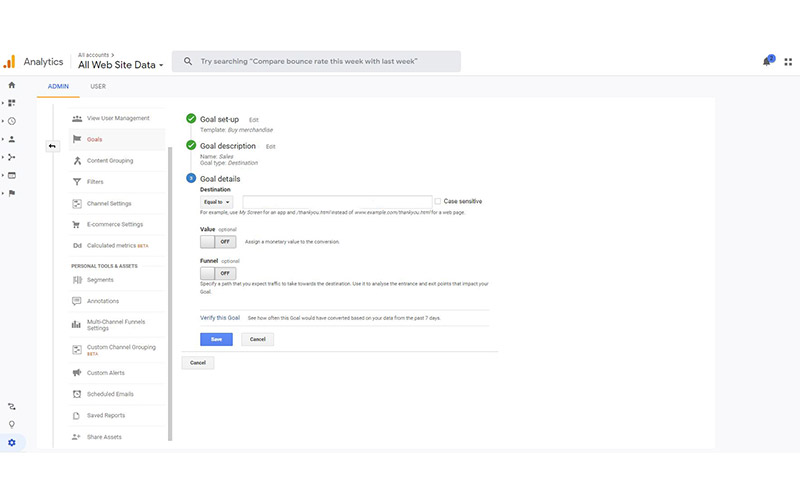
If you wish to set up more than one “Thank You” page for different occasions, toggle the Funnel option on and specify the page/s the user has to visit first. Setting a funnel will also help you analyse which pages are performing well in converting users.
Once you’re done, click the “Save” button to finalise the goal setup.
How Do I Use Google Analytics?
If you followed the above instructions, you just did. Congratulations, you now have a Google Analytics account set up and working for you.
To help you to a great start, here are some hints to ease you into the platform.
Understanding The User Menu
The reports in Google Analytics are arranged in several menus.
- Home – This menu displays the most important analytics at a glance. By default, the dashboard displays summarised data of the website performance during the last 7 days. The sections are pretty self-explanatory and user-friendly so you can easily judge the overall performance.
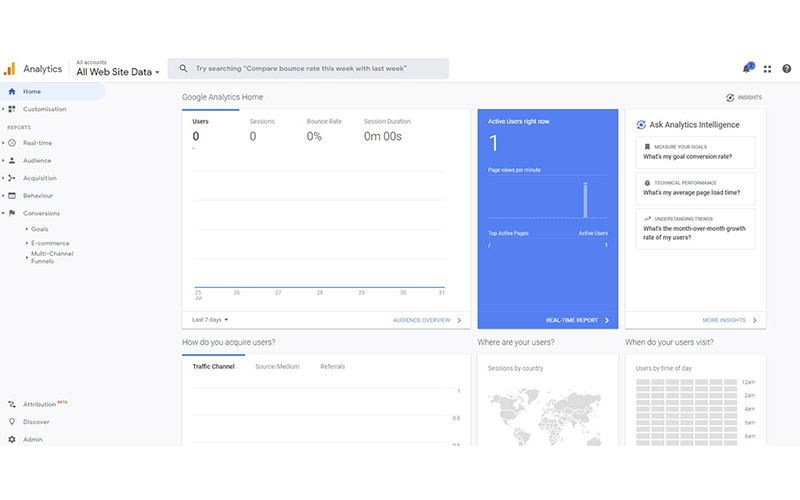
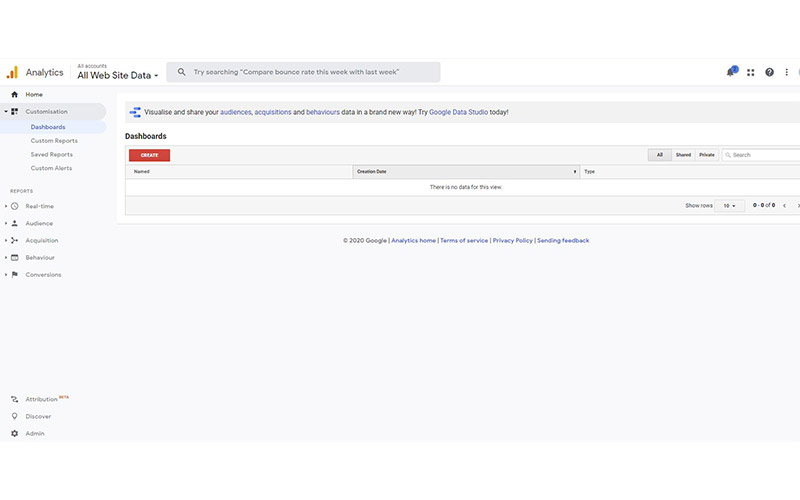
- Customisation – The menu allows you to create dashboards, reports, and alerts customised to your liking.
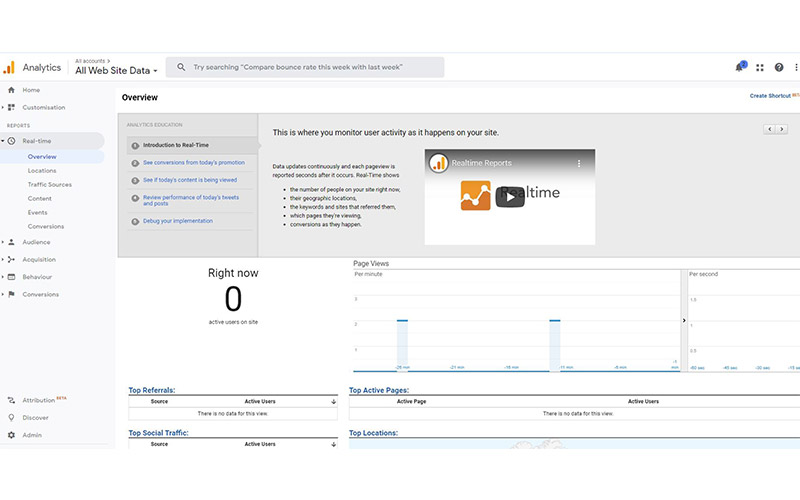
- Realtime – The menu allows you to see how many users are visiting your website at the moment, where they are from, which pages they are looking at, are they triggering any events, and more. The data only applies to currently active users.
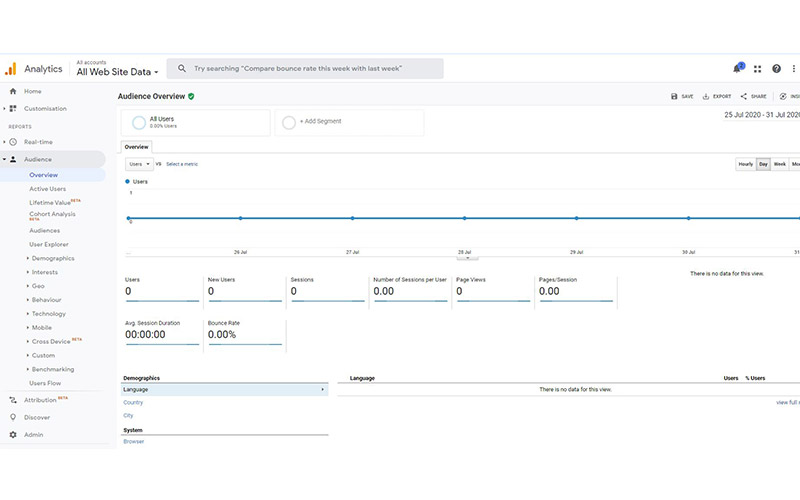
- Audience – The menu goes deep into the user data. It provides all the details about their demographics, interests, location, as well as device and browser information.
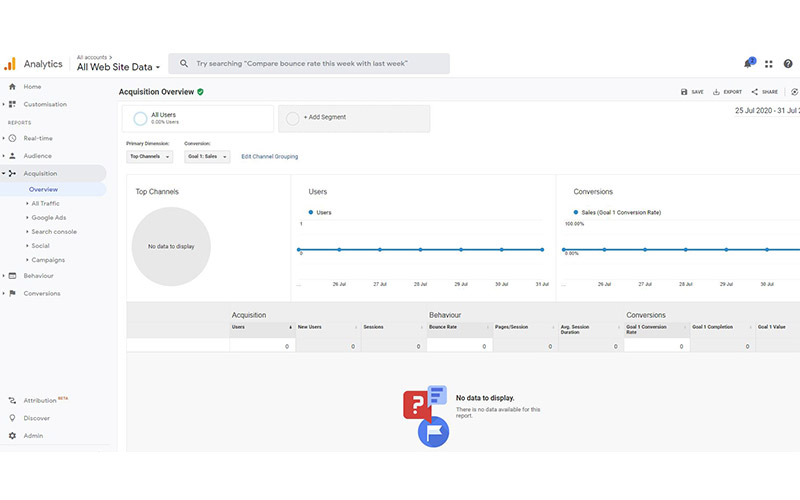
- Acquisition – The acquisition panel gives you detailed information on where your users come from. Did they visit your website directly, through a social media page, a referral or organic search?
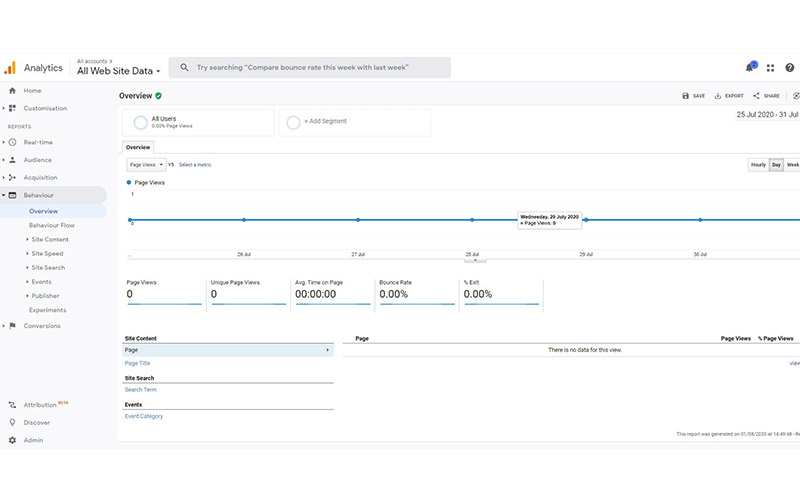
- Behaviour – The behaviour menu explains more about how people spend their time on your website. Apart from which pages are popular and which not, the information available also includes the speed of the website, the performed searches, and events’ popularity.
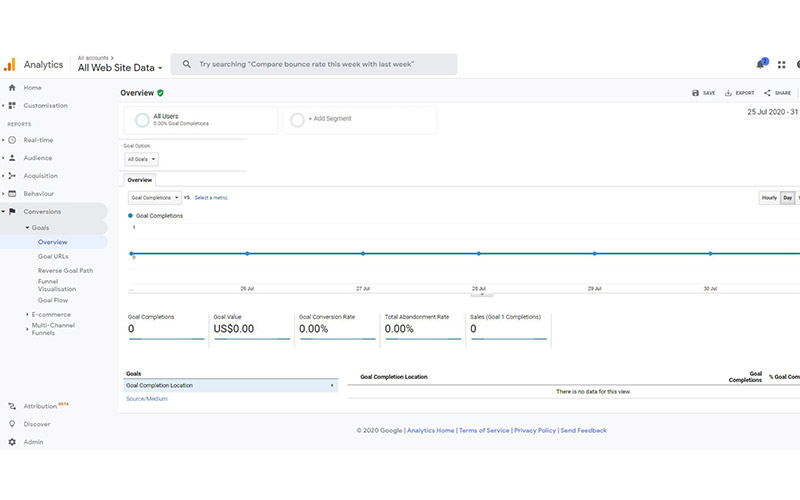
- Conversions – The menu allows you to keep track of how well your goals and eCommerce are performing.
What Is The Difference Between Metrics And Dimensions?
In general, Google Analytics is a relatively simple tool to use. There are some specifics, however, that you need to be aware of in order to take full advantage of the insights. One of these specifics that confuses many users is the difference between metrics and dimensions.
Simply put, metrics are the numerical part of the statistics, while dimensions provide the various attributes by which the statistic is presented. For example, if the reports show that 75% of your visitors are male users living in the Melbourne area with interest in travel and real estate, then the number of visits would be the metric and the location and interests attributes would be the dimensions.
While on their own they don’t give you anything useful, the aggregated information could be essential when targeting your next marketing campaign.
What Is The Difference Between Bounce Rate And Exit Rate?
The two terms are often misunderstood as they both track the rate at which users leave your website. Still, they measure different properties and it is therefore important that you know the difference.
Bounce rate refers to a user that opens a page on your website and then ends the session without visiting another page. In essence, they bounce right off the website after visiting their first page.
Exit rate, on the other hand, refers to the last page visited by the user before quitting the session. The exit rate is recorded regardless if the user has browsed other pages before that or not.
It’s worth mentioning that having a higher bounce or exit rate is not always a bad thing. For example, there are pages where the rates are naturally higher like blog posts or contact pages.
If you would like to know more or get in touch with a professional, do not hesitate to contact us.
Get A Free Website Design or Marketing Quote
Want help with your website or online marketing? Complete the below form to discuss your project and get a free quote.